Manage "Devices"
This article summarizes how to manage your "Devices" on the Kaiterra Data Platform
Once your building is properly set up, you can now add your devices to the building -- and locate them in the proper space -- so your data can be analyzed and included in our Analytics/Reporting features.
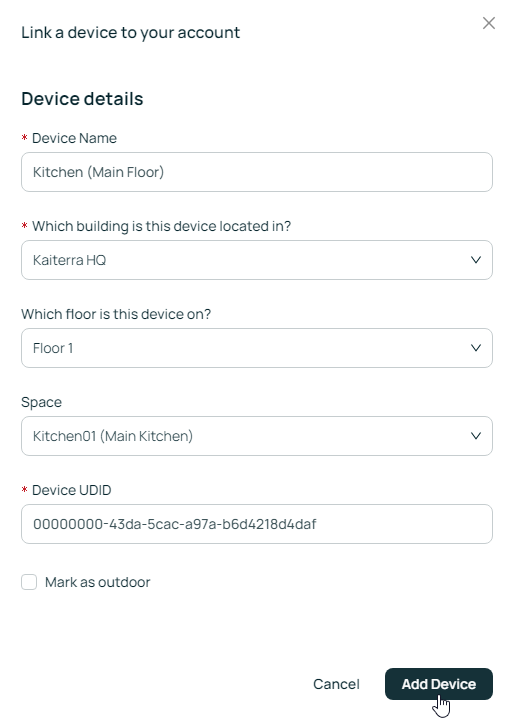
 When you add a device, you will be asked to name the device and locate it within the building you previously created. The most important piece of information is the Device UDID, which is how we identify this device from the others -- so make sure you capture this data when initially configuring the device.
- For the Sensedge: the UDID can be found under Settings --> Device Details
- For the Sensedge Mini: the UDID is seen during the configuration process. You can also go back to the Kaiterra Enterprise Configuration Tool and view its History to see previously configured device UDIDs.
- For the Sensedge Go: the device is already added to the Kaiterra Data Platform during the configuration process.
Once the device is added to your building, you can click on the name to view more Device Details.
From this page, you can view the device's information and current pollutant readings along the top and the historical data readings along the bottom.
The bottom icons that represent the different pollutants can be clicked on to view their specific historical data readings - and you can click on two of these pollutants to try and spot trends in the readings, such as high Humidity and PM readings indicating a humidifier might have turned on.


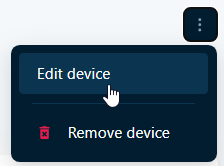
You can use the "More Options" button in the top-right to name - or rename - your device.
You can also click on the duration above the graph to change the time period in which you are viewing your historical data.
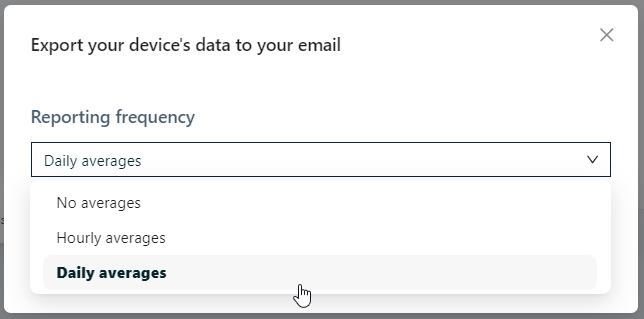
The bottom "More Options" button (above the graph) will allow you to export the data currently being displayed on the graph.

You can choose between raw data ("no averages" aka. minute-by-minute readings), hourly averages, or daily averages. This information will then be compiled into a CSV file and sent to your email.