When Should You Use This Page?
Use this page to quickly check how all your buildings are performing.
What You’ll See
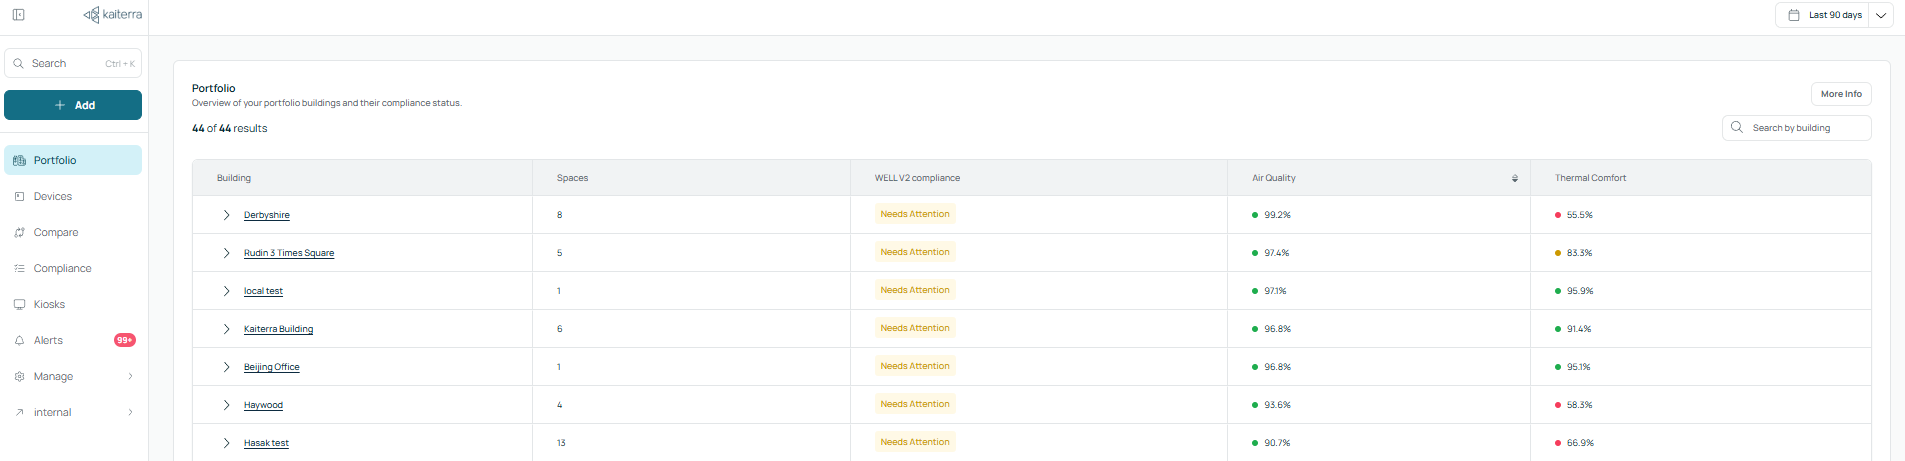
At the center of the page is a table with all your buildings. Each row represents one building.
You can click on any building to open its detailed view on the Building page. Next to it is the number of spaces, showing how many spaces or areas are set up in that building.
You’ll also see the WELL V2 status, which shows whether a building is passing or needs attention.
Alongside this are the Air Quality and Thermal Comfort scores. These are shown as percentages and represent how often the building stays within target conditions.
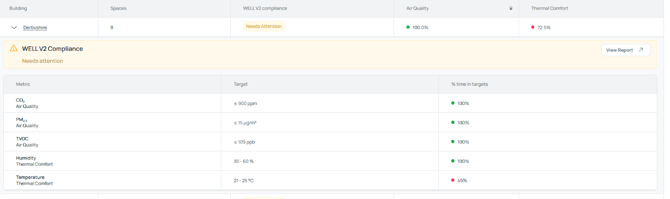
When you click on a building row, a WELL V2 Compliance breakdown will appear for that building. This shows key metrics such as CO₂, PM2.5, TVOC, temperature, and humidity, along with their target ranges and how often they meet those targets.
Customizing Your View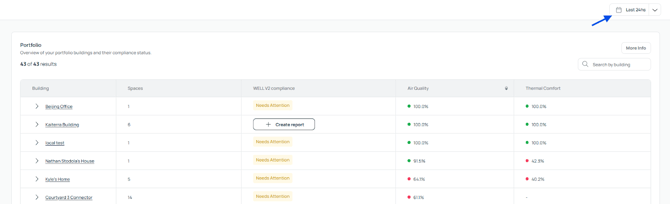
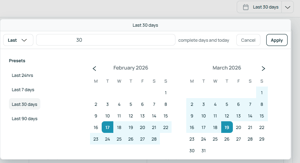
You can adjust the date range in the top-right to change the data timeframe. This updates all the metrics on the page.
Performance Ratings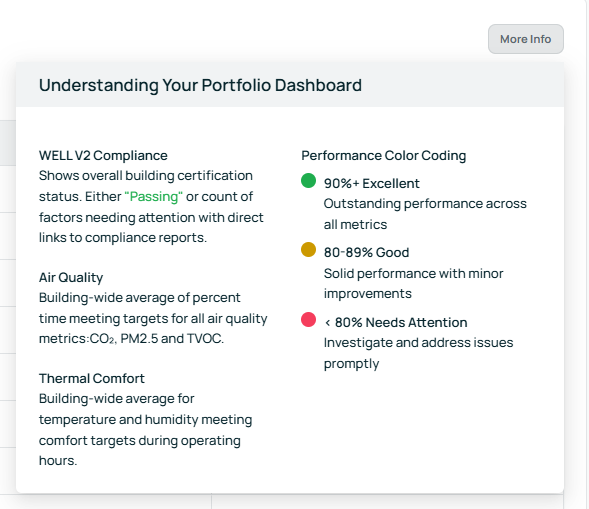
The platform uses colors to make performance easy to read. Green means excellent, yellow means good, and red means needs attention.